AgProcure partnered with Notitia to automate complex supplier contract analysis and reporting workflows using Qlik Cloud Analytics, helping reduce manual processes, improve reporting consistency and create a scalable foundation for future customer self-service reporting.
Qlik Cloud Analytics • Snowflake • Inphinity • Automated Reporting • Data Transformation • Dashboard Development • Data Strategy • Retail & Supply Chain • Qlik Application Automation • LandingAI • Claude Managed Agents
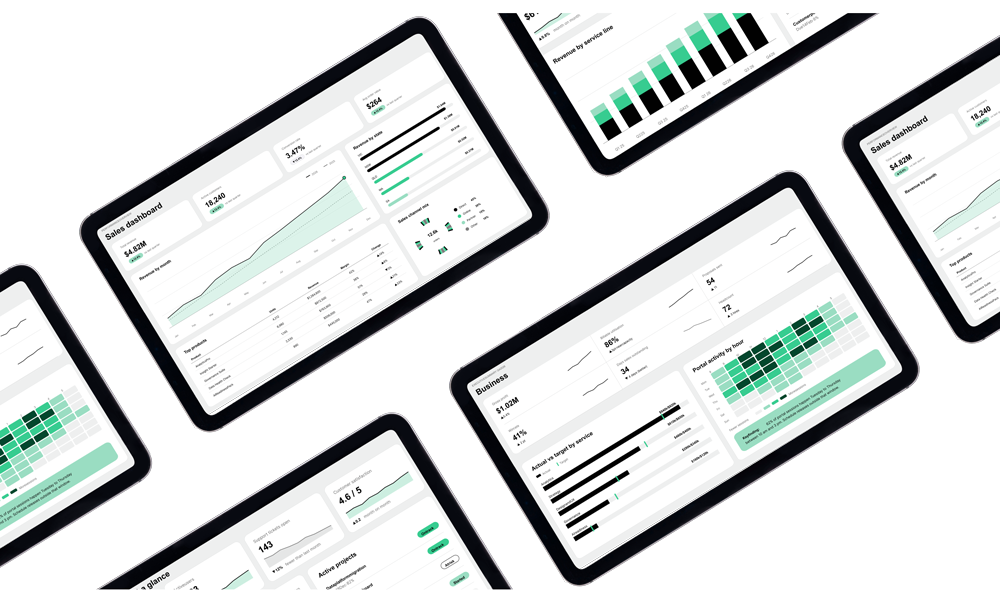
AgProcure partnered with Notitia to automate complex supplier contract analysis and reporting workflows using Qlik Cloud Analytics, helping reduce manual processes, improve reporting consistency and create a scalable foundation for future customer self-service reporting.
Qlik Cloud Analytics • Snowflake • Inphinity • Automated Reporting • Data Transformation • Dashboard Development • Data Strategy • Retail & Supply Chain • Qlik Application Automation • LandingAI • Claude Managed Agents
AgProcure provides supplier contract management and validation services to customers across the retail and procurement sector. A key component of this process involved manually analysing large volumes of transaction data and creating monthly reports for customers.
The existing process relied heavily on Microsoft Excel formulas, manual data transformations and multiple reporting steps, creating operational inefficiencies and limiting scalability as reporting requirements increased.
AgProcure required a solution that could automate the bulk of the reporting and analysis workflow while maintaining flexibility for review, validation and future enhancement.
The organisation also wanted to establish a long-term reporting environment capable of supporting secure customer dashboards, automated report distribution and future AI-supported data classification.
AgProcure faced several operational and technical challenges:
• Heavy reliance on manual Microsoft Excel processes for data transformation and reporting
• Significant time spent validating supplier pricing and transaction variances
• Multiple disconnected reporting steps increasing operational overhead
• Difficulty scaling reporting processes across approximately 50 retailer reports
• Lack of a centralised reporting and analytics environment
• Need for secure customer-level reporting and row-level access controls
• Requirement to support future AI and fuzzy logic classification capabilities
• Need to balance short-term operational improvements with long-term scalability
AgProcure needed a scalable data and analytics solution that could automate high-effort processes while creating a foundation for future customer reporting and operational growth.

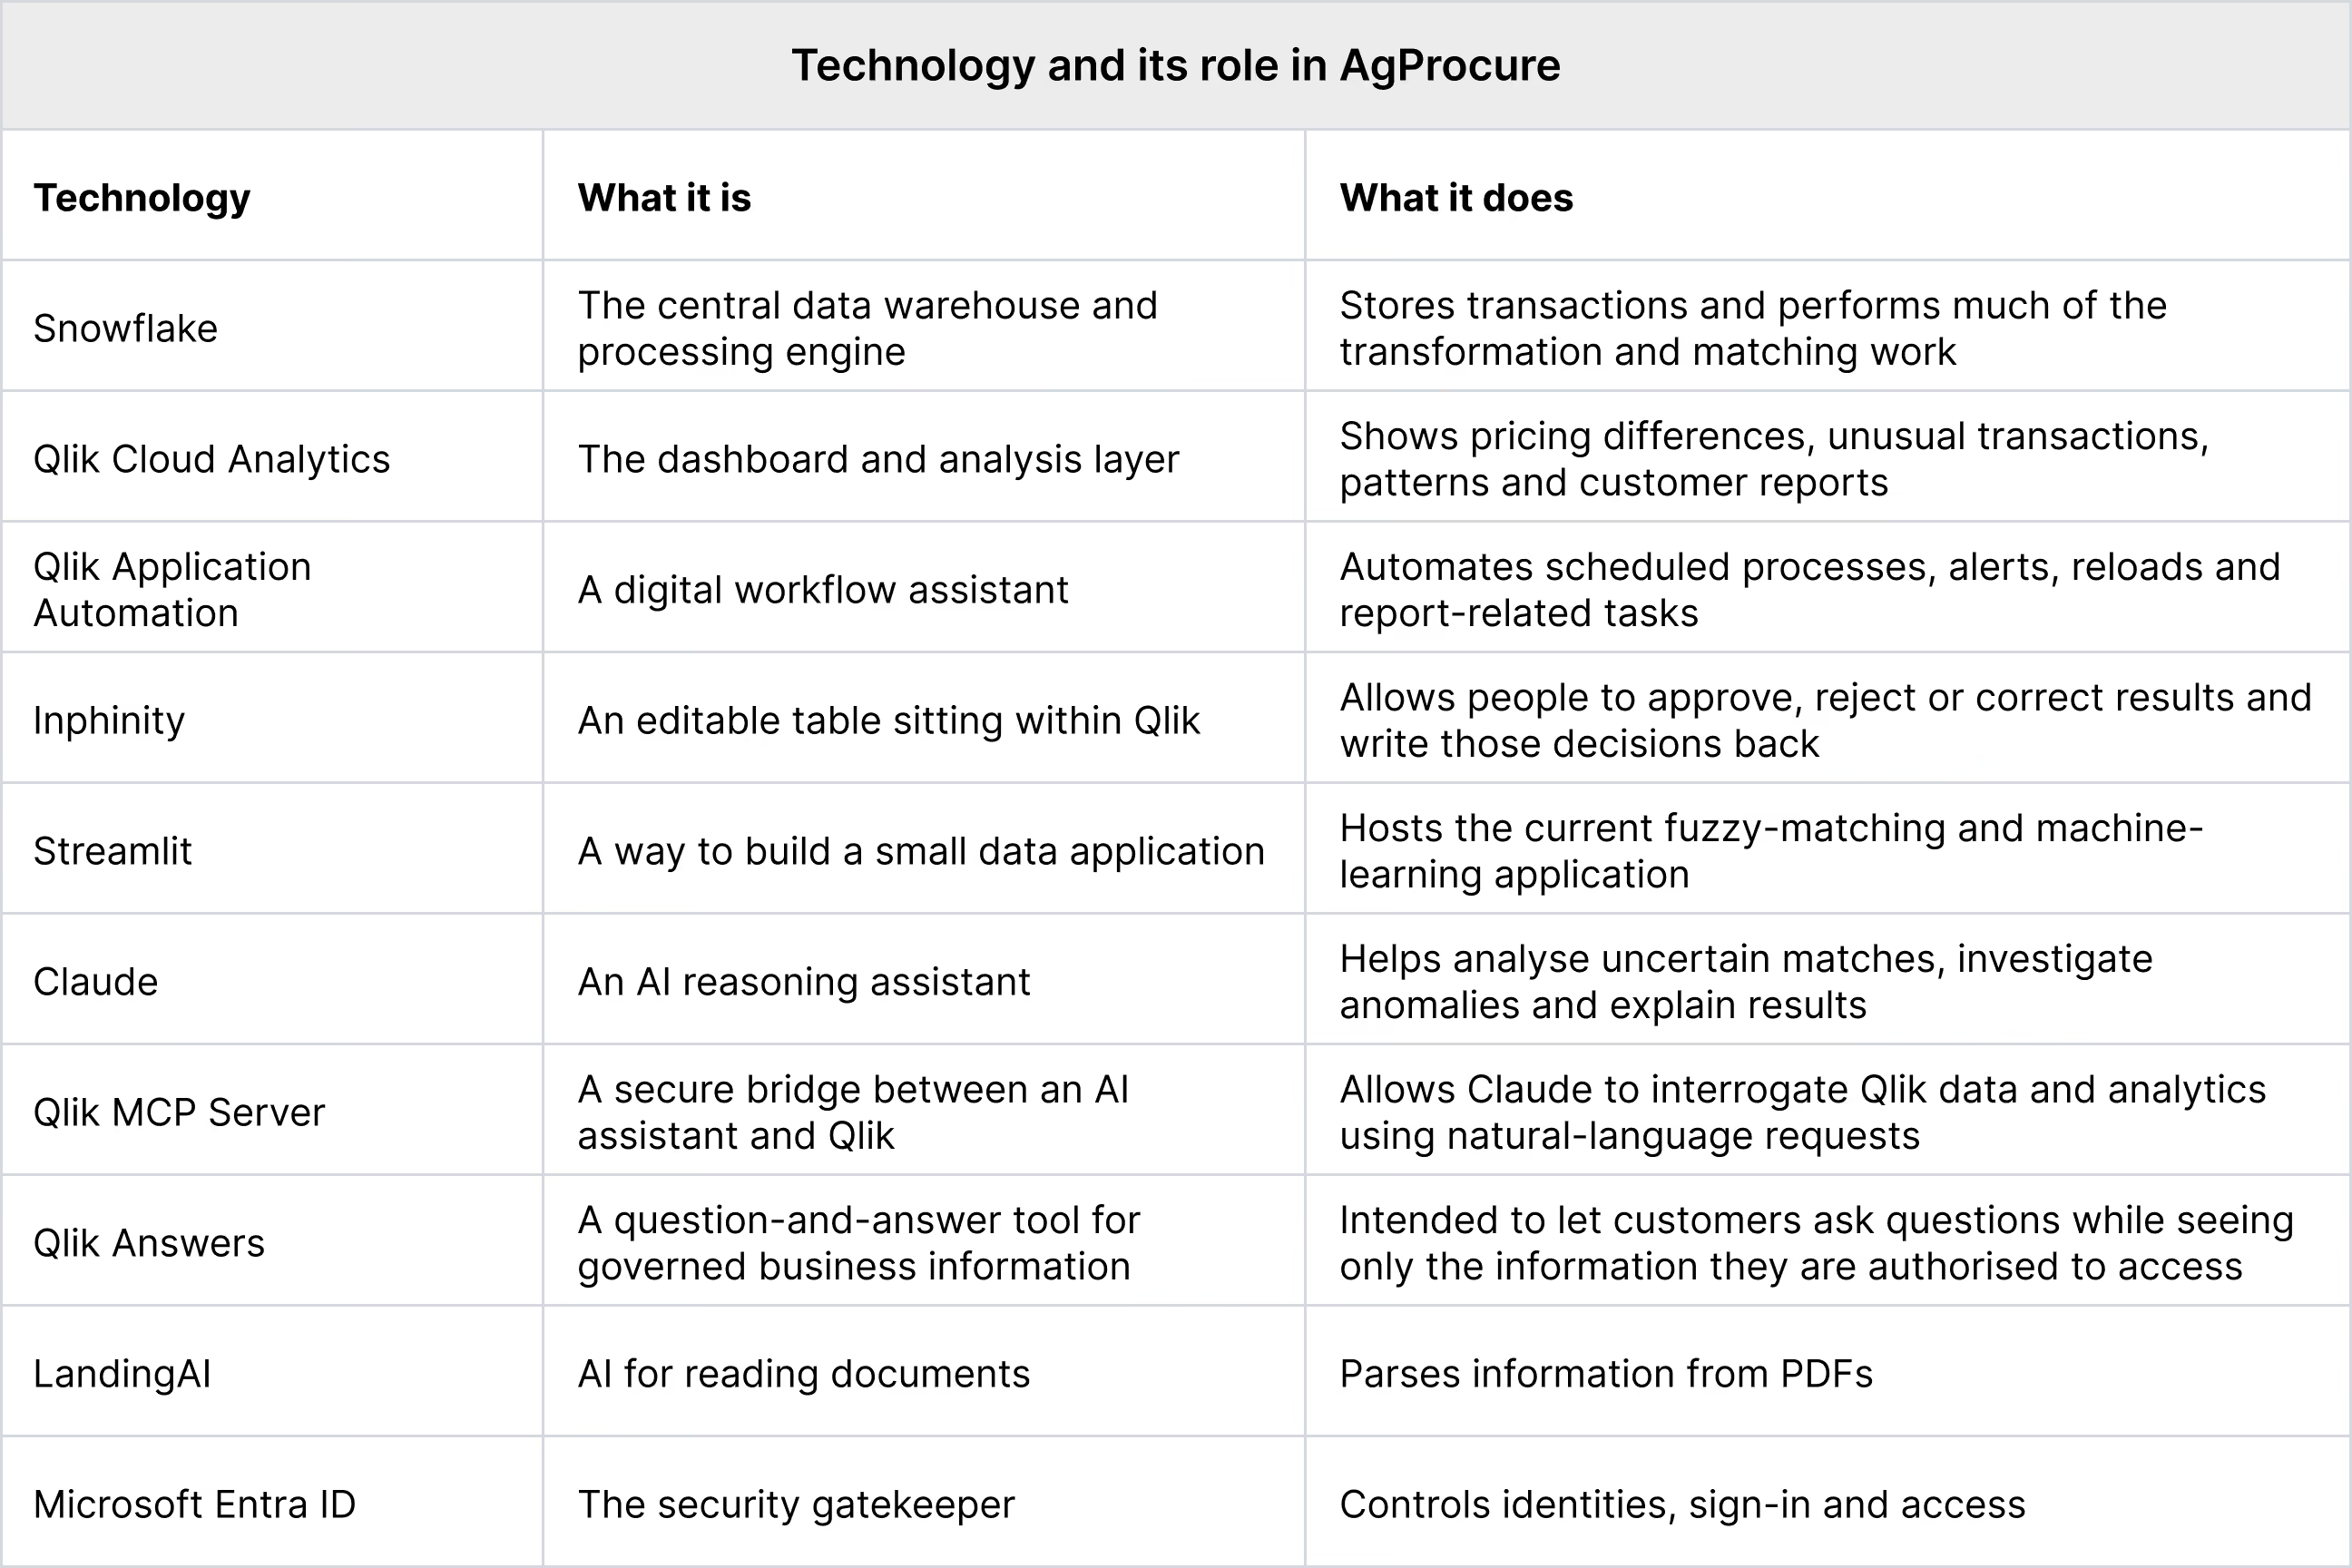
Notitia partnered with AgProcure to design and implement a staged data and analytics solution focused on automating transaction analysis, streamlining reporting workflows and establishing a scalable cloud-based analytics environment.
The project began by reviewing AgProcure’s existing manual workflow and identifying opportunities to automate high-effort reporting and transformation processes.
Using Snowflake as the core data platform alongside Qlik Cloud Analytics, Notitia transcribed AgProcure’s existing Excel formulas and transformation logic into automated transformation processes capable of processing raw transaction files and generating structured outputs. Snowflake supports the bulk of the data transformation, while Qlik provides the analytics, reporting and dashboard environment.
This automation significantly reduced manual handling across the reporting workflow while maintaining the ability for teams to review and validate transaction variances before final reporting.
The solution also uses Inphinity functionality to allow authorised users to write records back through the analytics interface. This extends the solution beyond traditional read-only dashboards, allowing users to create and update records and interact directly with operational data through Qlik.
The solution was designed using a staged implementation approach, allowing AgProcure to validate outputs and workflows before moving into a full production environment.
Alongside the automation of transaction analysis, Notitia designed a future-state reporting environment capable of supporting dynamic dashboards, secure customer access, automated report distribution and future AI-supported product classification.
The solution also incorporated cloud infrastructure planning, environment configuration and scalable reporting architecture to support future growth.
Key solution elemtns included:
• Automation of transaction analysis workflows using Snowflake alongside Qlik Cloud Analytics
• Migration of manual Excel formulas and reporting logic into automated Snowflake and Qlik Cloud workflows
• Automated variance identification across supplier pricing and retailer margin analysis
• Statistical analysis using historical transaction data to identify market pricing trends
• Creation of dynamic reporting outputs for customer reporting and internal analysis
• Integration of Inphinity writeback functionality, allowing authorised users to create and update records through the analytics interface
• Development of interactive analytics solutions that support operational input and action rather than read-only reporting
• Development of rolling 12-month purchase summary reporting
• Consolidated reporting workflows for approximately 50 retailer reports
• Establishment of a secure Qlik Cloud Analytics environment
• Configuration of reload schedules, monitoring and automated alerts
• Design of row-level security and managed access controls for customer reporting
• Planning for future customer self-service dashboards and reporting distribution
• Integration planning for future AI-supported fuzzy logic classification using Snowflake
• Development of scalable cloud-based storage and reporting architecture
Notitia’s feature-driven development approach allowed AgProcure to progressively validate functionality and reporting outputs throughout delivery, reducing implementation risk and supporting practical operational improvements from the outset.
AgProcure now has a scalable analytics and reporting framework designed to automate large components of its supplier contract management and reporting processes.
By replacing manual Excel-driven workflows with automated Snowflake and Qlik Cloud Analytics processes, the organisation has significantly reduced operational complexity and created a more efficient reporting pipeline.
The automated transaction analysis process improves consistency across reporting outputs while reducing the manual effort previously required to analyse supplier pricing, retailer margins and transaction variances.
Inphinity also enables authorised users to interact with operational data through the analytics environment. Rather than relying solely on read-only dashboards, users can create and update records within the solution, supporting more connected and interactive workflows.
The staged cloud-based architecture also provides AgProcure with a clear pathway toward secure customer dashboards, automated report distribution and future AI-supported transaction classification.
Importantly, the project established a scalable reporting model capable of supporting a growing customer base without proportionally increasing operational overhead.
The reporting environment was designed to support unlimited users, secure access controls and a build-once, deploy-to-many reporting approach, helping simplify ongoing management and future expansion.
AgProcure can now:
• Reduce manual effort associated with monthly reporting workflows
• Improve consistency across transaction analysis and reporting outputs
• Automate complex pricing and variance analysis processes
• Scale reporting delivery across multiple customer groups more efficiently
• Establish secure customer-specific dashboards and reporting access
• Improve visibility across supplier pricing and contract validation processes
• Create and update authorised records through interactive analytics workflows
• Move beyond read-only dashboards by enabling users to interact with operational data
• Create a scalable foundation for future AI-supported data classification
Support future operational growth through cloud-based analytics infrastructure
Creating scalable reporting foundations through automation
This project demonstrates how organisations can modernise complex operational reporting processes by combining automation, cloud analytics and scalable reporting architecture.
Rather than continuing to expand manual reporting workflows, AgProcure invested in creating a structured analytics environment capable of supporting both immediate operational improvements and long-term scalability.
By automating repetitive analysis and reporting tasks, the organisation can focus more time on reviewing insights, validating exceptions and supporting customer outcomes.
Inphinity further extends this capability by allowing authorised users to contribute to operational workflows directly through the analytics environment, instead of using dashboards solely to view information.
The staged implementation approach also ensured that automation and reporting improvements could be progressively validated before expanding into broader customer-facing functionality.
Most importantly, the project created a scalable reporting foundation designed to support future operational growth, customer self-service reporting and AI-supported analysis without requiring major redevelopment.


“One of the reasons that we chose Notitia was that they really aligned with our core values. A really important part of choosing a vendor, for us, was making sure that we had someone that we could work really well with and understand what we were trying to do."

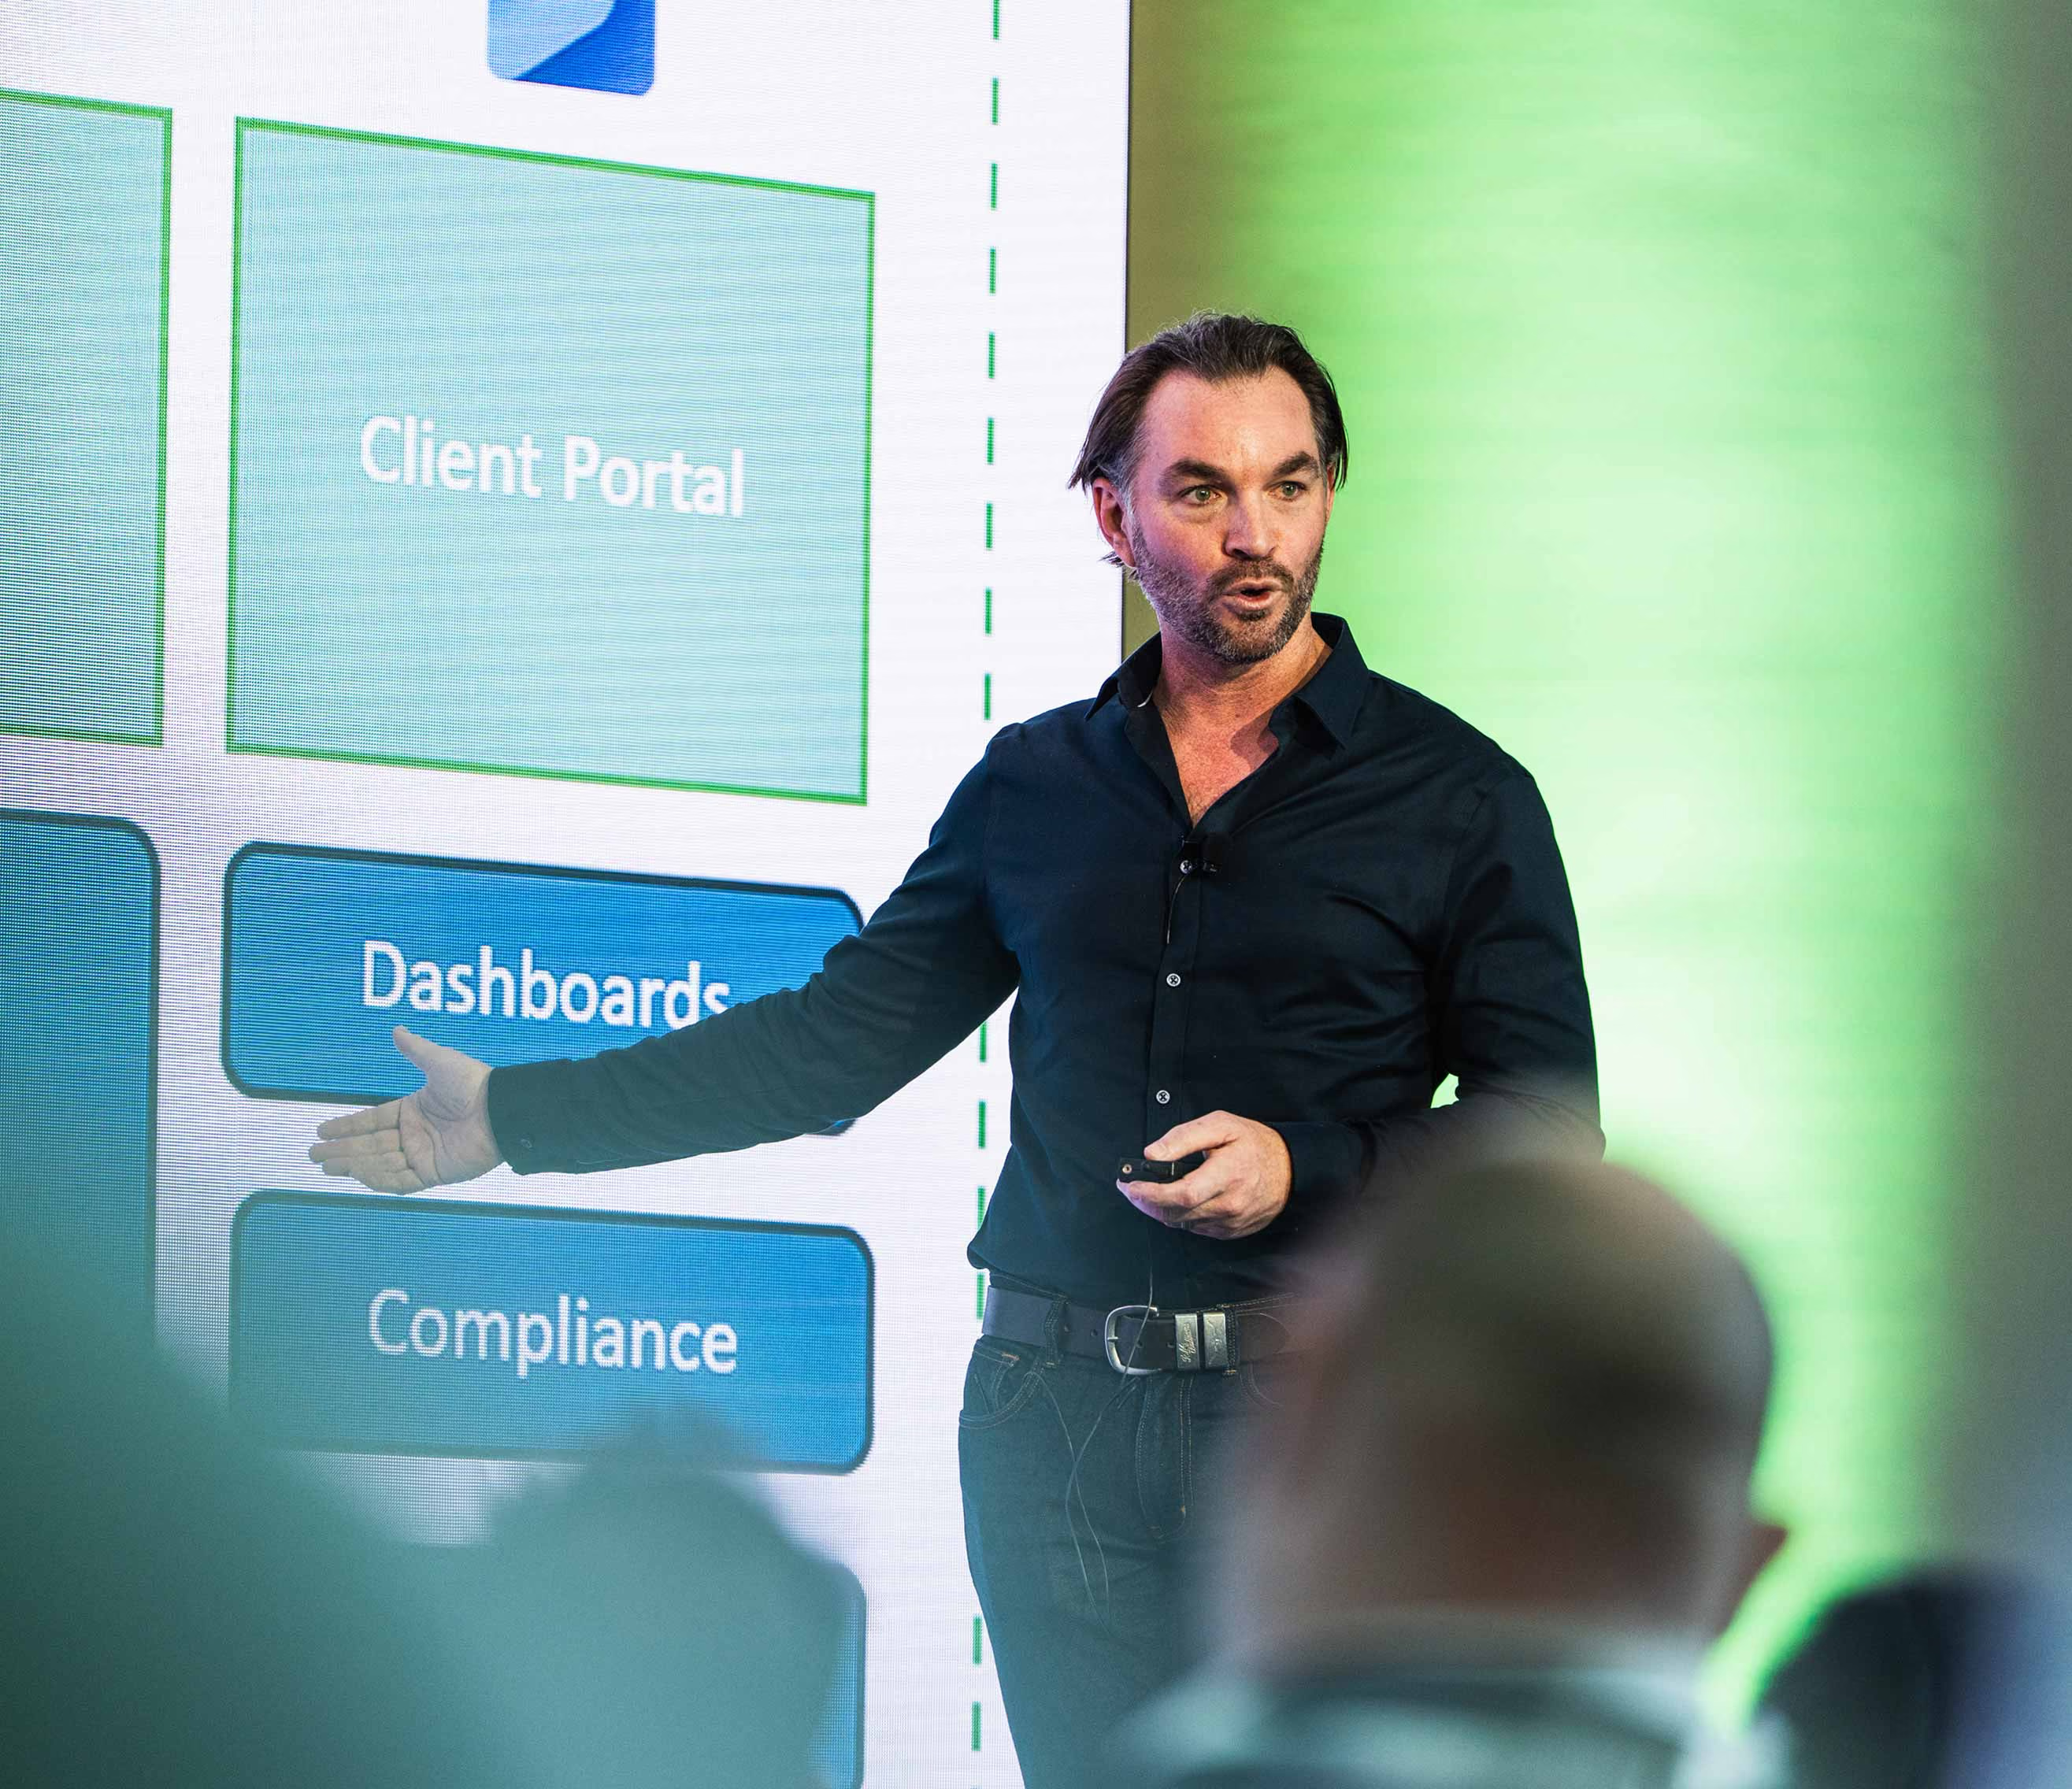
“By automating the repetitive parts of our reporting process, we can spend less time working through spreadsheets and more time reviewing exceptions and supporting our customers. Importantly, the solution retains the flexibility for our team to validate results while giving us a scalable foundation for future customer reporting and analysis.”
AgProcure provides supplier contract management and validation services, supporting organisations with procurement analysis, transaction validation and supplier reporting processes.
The organisation works with large volumes of transactional purchasing data to identify pricing variances, validate supplier agreements and support reporting across multiple retailer groups.





Automated reporting is the process of using technology to automatically transform, analyse and distribute data-driven reports without requiring extensive manual effort.
This often includes automating data ingestion, transformation logic, calculations, dashboard generation and report distribution.
At Notitia, automated reporting solutions are designed to reduce manual processes, improve reporting consistency and create scalable analytics environments that support operational decision-making.

Manual transaction analysis processes can become time-consuming, inconsistent and difficult to scale as reporting volumes increase.
By automating analysis workflows, organisations can reduce operational effort, improve consistency and identify pricing variances or anomalies more efficiently.
Automation also creates a stronger foundation for future analytics, reporting and AI-supported decision-making.
One of the most effective ways to scale customer reporting is through a build-once, deploy-to-many reporting model.
This approach allows organisations to create common reporting structures that can securely deliver customer-specific insights through row-level security and managed access controls.
By automating reporting workflows and centralising analytics environments, organisations can significantly reduce the operational overhead associated with managing multiple customer reports.
Qlik Cloud Analytics allows organisations to consolidate data sources, automate transformations and deliver dynamic dashboards and reporting through a secure cloud-based environment.
This helps organisations reduce reliance on spreadsheets, improve reporting visibility and scale reporting processes more effectively across teams or customers.
Qlik Cloud Analytics also supports row-level security, scheduled reloads, automated alerts and self-service reporting capabilities.
Cloud-based analytics environments provide organisations with scalable infrastructure, improved accessibility and simplified management of reporting and analytics solutions.
This allows businesses to securely deliver reporting to larger user groups while reducing infrastructure overhead and improving operational flexibility.
Cloud analytics environments also support future expansion, automation and integration with additional technologies such as AI and machine learning.
Traditional dashboards are generally designed for users to view and analyse information. Writeback functionality allows authorised users to create or update records through the analytics interface, extending the dashboard from a read-only reporting tool into a more interactive operational solution.
Using Inphinity with Qlik Cloud Analytics, organisations can enable users to interact with operational data while maintaining appropriate access controls and structured workflows.